The solar market in Uganda is experiencing remarkable growth and transformation, as the country embraces renewable energy solutions to address its energy challenges. With abundant sunlight and a growing demand for clean and reliable power, solar technologies are becoming increasingly popular among individuals, businesses and institutions.in this article we will explore the current state of solar market in Uganda in terms of installation capacity trends, total solar PVs installed and market size estimate.
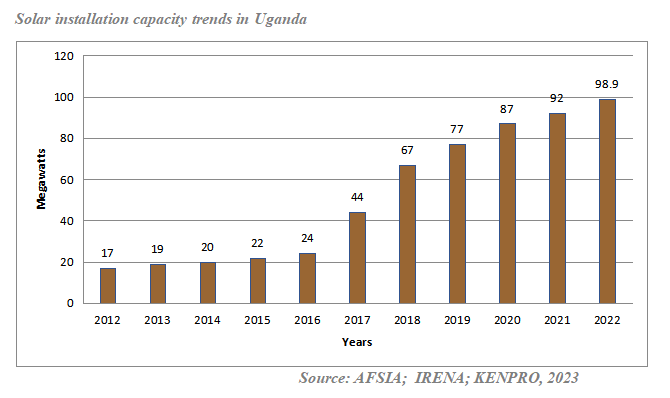
Solar installation capacity trends
Over the last decade, Uganda’s solar energy sector has seen tremendous capacity increase. Beginning with a moderate 17 MW in 2012, capacity progressively expanded to 19 MW in 2013, and then to 20 MW in 2014. The capacity increased steadily in the following years, reaching 22 MW in 2015 and 24 MW in 2016. The expansion proceeded, as capacity in 2017 was 44 MW, and it increased to 67 MW in 2018. The capacity expanded to 77 MW in 2019 and will increase by 10 MW in 2020 to a total of 87 MW. There was a big growth in 2021, reaching 92 MW, followed by a significant increase of around 6.9 MW, reaching a total of 98.9 MW Uganda’s installed solar energy capacity in 2022. However, this figure excludes residential solar installations.
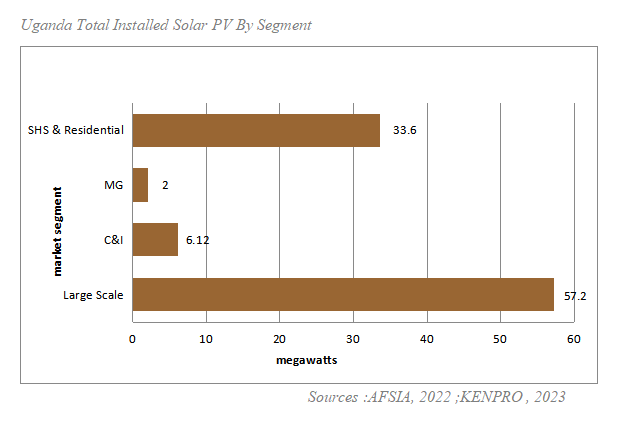
Uganda Total Installed Solar PV By Segment
As of 2022, the total PV installed in Uganda stands at 57.2 MW in largescale, 6.12 MW in C&I, 2 MW in MG and 33.6MW in SHS & residential .The figure below shows an overview of total PV installed.
Uganda Solar Market Size Estimate
This article utilizes the metric of total installed Megawatts (MW) to measure the scale of solar market size in Uganda. According to Forbes (2022), the average cost to install solar panels per watt is between $0.90 and $1.50 per watt for the materials and an additional 25% for the labor. For the purpose of this article, the rate of $1.5 per watt at installation level including materials and labor was used to determine the market size for SHS & Residential, C&I and MG except large scale, which was computed at $2.4 per watt. This rate represents the estimated cost per Watt at the installation level, reflecting the potential investment required to establish and operate solar power project.
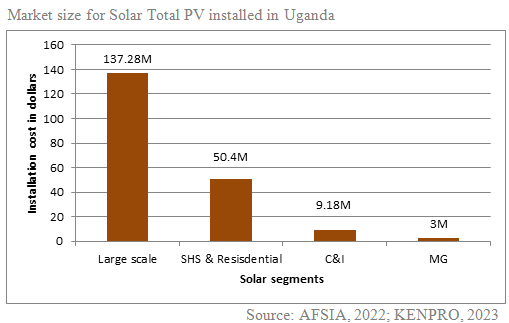
As shown in the figure, Uganda’s estimated cumulative solar market size at installation stage based on various solar segments, namely Large scale ($137.2 m), Solar Home Systems ($50.4m), C&I ($9.18M) and MG ($3m) stood at 200 million dollars in 2022.
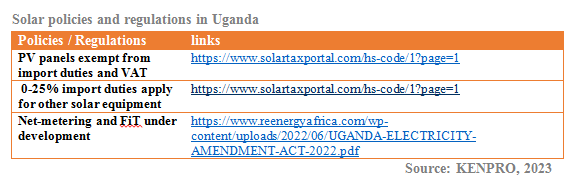
Solar Policies/Regulations in Uganda
These are all applicable rules in terms of duties, taxes, exemptions, net-metering, wheeling, feed-in tariffs or any special government program that supports or restricts the deployment of solar or renewable in general in Uganda.
Conclusion
In conclusion, Uganda’s solar energy sector has experienced a positive trajectory with increasing solar PV installations, a growing market size, and government support in the last decade. This trend suggests a promising future for solar energy in the country, enabling a transition towards cleaner and more sustainable energy sources.
References
AFSIA (2023). Annual Solar Outlook 2023.
IRENA (2022). Renewable Energy Statistics 2022.
KENPRO (2023). Kenpro Solar Program (KSP)