By Anthony M. Wanjohi: Solar energy is one of the key sources of clean energy and plays a critical role in addressing the effect of climate change. Thus, the future in clean energy lies in investing in solar solutions. This article briefly provides an overview of solar capacity installation growth trends in Kenya’s context for the period between 2012 and 2022. The article further provides an overview of solar market size.
Solar Installation Capacity Trends in Kenya
Over the span of a decade, the solar energy sector in Kenya witnessed significant growth in capacity. Starting at a modest 3 MW in 2012, the capacity gradually increased to 7 MW in 2013 and further surged to 16 MW in 2014. The following years showed a steady upward trend, with the capacity reaching 30 MW in 2015 and 31 MW in 2016. The growth continued as the capacity in 2017 was 38 MW and experienced a remarkable growth to 105 MW in 2018. From 2019 to 2020, the capacity remained relatively stable at around 106 MW, indicating a consistent reliance on solar energy. However, in 2021, there was a substantial increase, reaching 147 MW, followed by a significant rise of approximately 169.2 MW of Kenya’s total installed solar energy capacity by 2022. However, this figure excludes residential solar installations. The figure below shows estimated installed solar energy capacity between 2012 and 2022 in Kenya.

Kenya Total Installed Solar PV By Segment
Kenya’s installed PV capacity is divided into Solar Home Systems & Residential (42.02MW), Commercial & Industrial (40.6MW), Mini-Grid(1.65MW), and, Large-Scale (84.8MW) installations contributing significantly to the total capacity of 169 MW. The figure below shows an overview of total PV installed.
 Kenya Solar Market Size Estimate
This article utilizes the metric of total installed Megawatts (MW) to measure the scale of solar market size in Kenya. According to Forbes (2022), the average cost to install solar panels per watt is between $0.90 and $1.50 per watt for the materials and an additional 25% for the labour. For the purpose of this article, the rate of $1.5 per watt at installation level including materials and labour was used to determine the market size for SHS & Residential, C&I and MG except large scale, which was computed at $2.4 per watt. This rate represents the estimated cost per Watt at the installation level, reflecting the potential investment required to establish and operate solar power project.

As shown in the figure, Kenya’s estimated cumulative solar market size at installation stage based on various solar segments, namely Large scale ($203.5m), Solar Home Systems ($63m), C&I ($61.4M) and MG ($2.5m) stood at 330 million dollars in 2022.
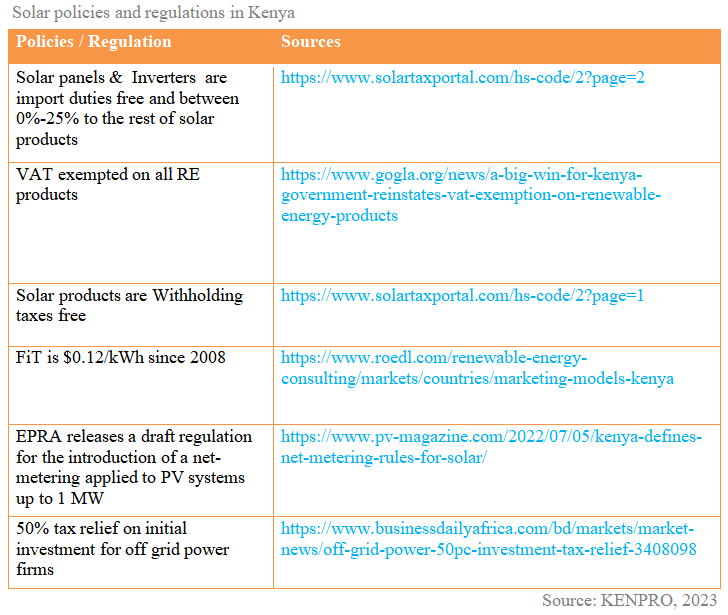
Solar Policies / Regulations in Kenya
Policies and regulations are all rules in terms of duties, taxes, exemptions, net-metering, wheeling, feed-in tariffs or any special government program that supports or restricts the deployment of solar or renewables in general in Kenya. Table below shows the main solar policies and regulations.
In conclusion, Kenya’s solar energy sector has experienced a positive trajectory with increasing solar PV installations, a growing market size, and government support in the last decade. This trend suggests a promising future for solar energy in the country, enabling a transition towards cleaner and more sustainable energy sources.
Resources for Further Reading
AFSIA (2023). Annual Solar Outlook 2023. Rwanda: AFSIA
IRENA (2022). Renewable Energy Statistics 2022. Abu Dhabi: IRENA
For inquiries about Biogas installation and maintenance at institutional and household levels, kindly contact Kenpro Biogas Program Technical Team or call us +254725788400.